Annual Report – July 2020-2021
The California Grants Portal (grants.ca.gov), born out of the Grant Information Act of 2018 (Stats. 2018, Ch. 318), launched on July 1, 2020. Over 1 million visitors representing nonprofits, businesses, public agencies, tribal governments, and more, came to the Grants Portal to find funding administered by California state agencies.
The California State Library collaborated with more than 50 state agencies, departments, commissions and bureaus that award grants or loans on a competitive or first-come basis to build this user-centered one-stop-shop funding destination.
During the 2020-2021 fiscal year, the state administered a significant amount of new funding focused on COVID-19 relief, resulting in a handful of exceptionally large grant and loan opportunities. These outlier opportunities may disproportionately affect the mean value of the data, such as when trying to determine how much funding was available per opportunity. View or download current California Grants Portal data on the California Open Data Portal.
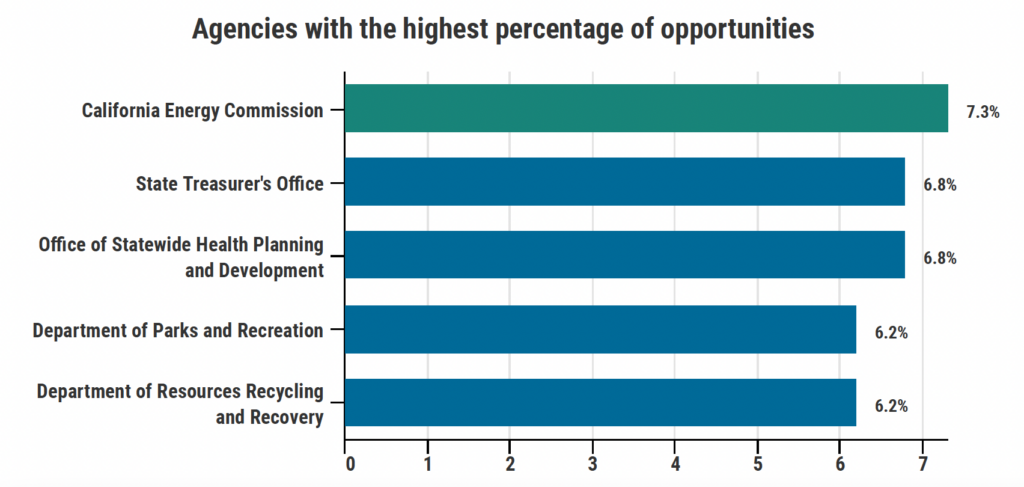
01. How many state agencies posted grants on the California Grants Portal?
52
boards, commissions, councils, agencies, departments and offices
published funding opportunities on the Grants Portal
California State Library, California Grants Portal Data, July 2021. View more details.
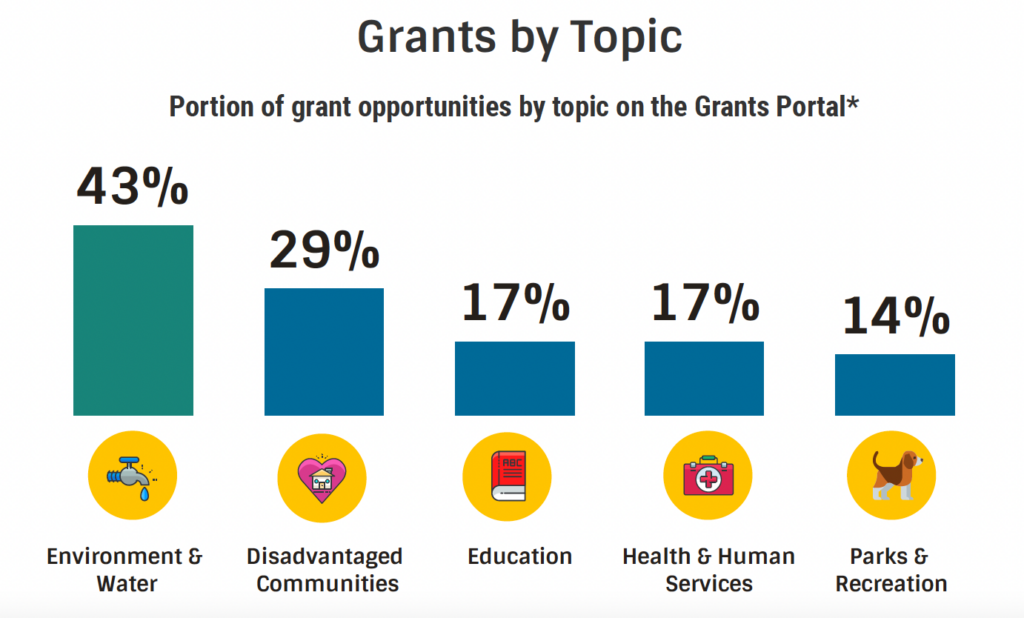
02. How many opportunities were available on the California Grants Portal?
355
funding opportunities were published on the Grants Portal
California State Library, California Grants Portal Data, July 2021. View more details.
03. How do agencies determine available funding per opportunity?*
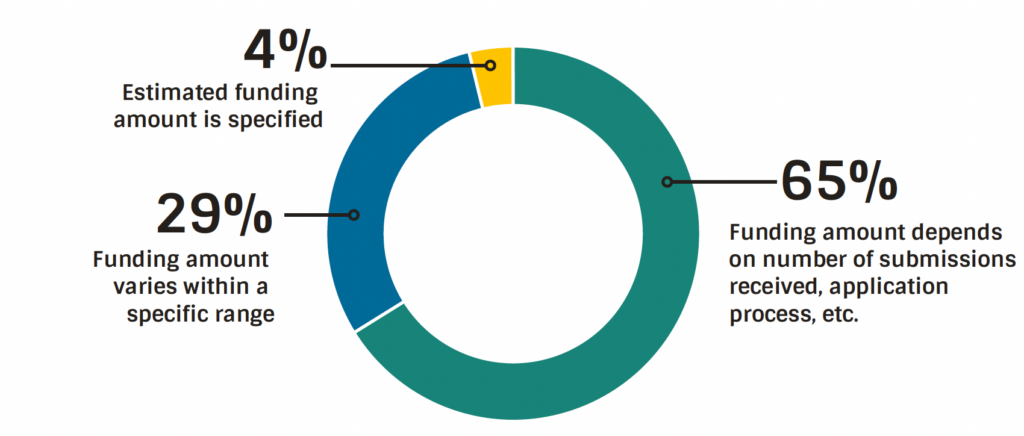
California State Library, California Grants Portal Data, July 2021. View more details.
ls.
04. How much funding was available per opportunity?*
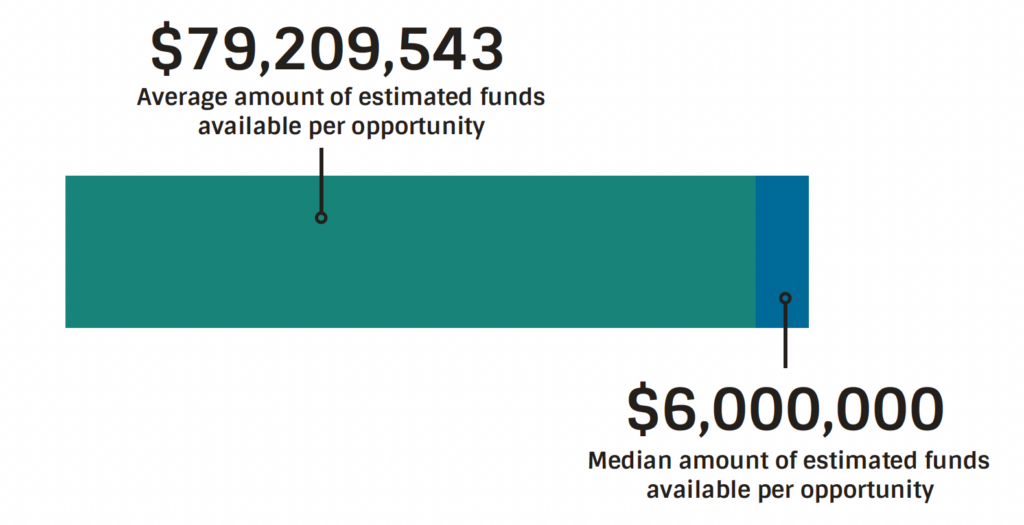
California State Library, California Grants Portal Data, July 2021. View more details.
05. How many visitors came to the California Grants Portal?
1,110,051
users visited the Grants Portal between July 2020 and July 2021
California State Library, California Grants Portal Data, July 2021, Google Analytics
06. Which California Grants Portal pages were visited the most?
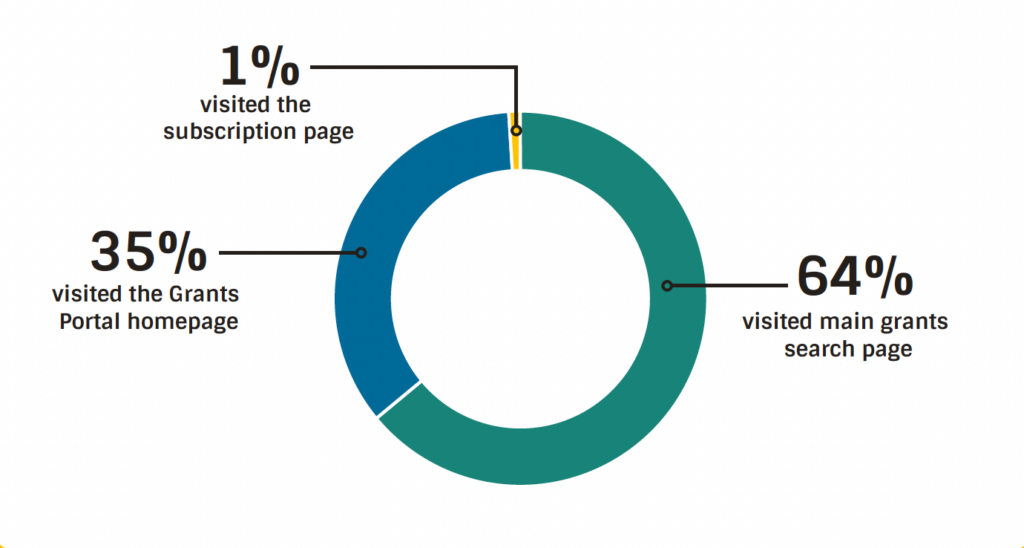
California State Library, California Grants Portal Data, July 2021, Google Analytics
07. How many applications were submitted?
457,000
Applications submitted for opportunities available on the Grants Portal*
*Calculation includes applications submitted for ongoing grants through July 2021
California State Library, California Grants Portal Data, July 2021. View more details.
08. What’s next for the California Grants Portal?
Starting July 2022, grantmaking agencies will submit post-award data, such as grant recipient, purpose of grant awarded, and geographic location served, to the California Grants Portal.
Data transparency is central to our mission at the State Library, and we plan to continue to share this data in an easy-to-use format so all of our stakeholders can learn more about the projects supported by state grant and loan funding.
Contact CAGrantsPortal@library.ca.gov for more information!