Annual Report – July 2022-2023
The California Grants Portal (grants.ca.gov), born out of the Grant Information Act of 2018 (Stats. 2018, Ch. 318), launched on July 1, 2020. To create this user-centered one-stop-shop funding destination, the California State Library collaborated with more than 60 state agencies, departments, commissions, and bureaus that award grants or loans on a competitive or first-come basis. AB132 (section 8334.1) expanded the Grants Portal mission, requiring state grantmakers to submit post award data for all grants closing on or after July 1, 2022.
Comparing data from fiscal year 2021-2022 to 2022-2023, the Grants Portal saw growth in the number of visitors to the portal (25%), the number of grant and loan opportunities posted to the portal (48%), as well as the number of California state government entities posting their opportunities on the portal (3%).
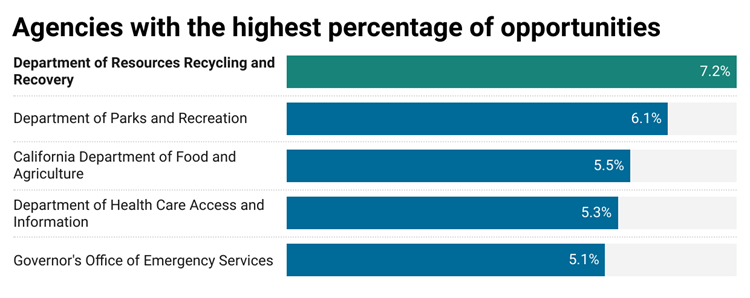
The rise in opportunities on the portal this year is due primarily to an increase in grantmaking activity by the Department of Education, the Department of Resources Recycling and Recovery, the Department of Parks and Recreation, the California Energy Commission, the Employment Development Department, and the Governor’s Office of Business and Economic Development.
Grantmaking entities new to the portal in fiscal year 2022-2023 were the California Environmental Protection Agency, the California State Council of Developmental Disabilities, the Department of Aging, and the Department of Health Care Services.
View or download current California Grants Portal data from the California Open Data Portal.
01. How many state entities posted grants on the California Grants Portal?
61
boards, commissions, conservancies, councils, agencies, departments, and offices published funding opportunities on the Grants Portal—a 3% increase in participation from the previous fiscal year.
California State Library, California Grants Portal Data, July 2023. View more details.
02. How many opportunities were available on the California Grants Portal?
722
funding opportunities published on the Grants Portal—a nearly 48% increase in opportunities from 2021-2022.
California State Library, California Grants Portal Data, July 2023. View more details.
03. How do agencies determine available funding per opportunity? *
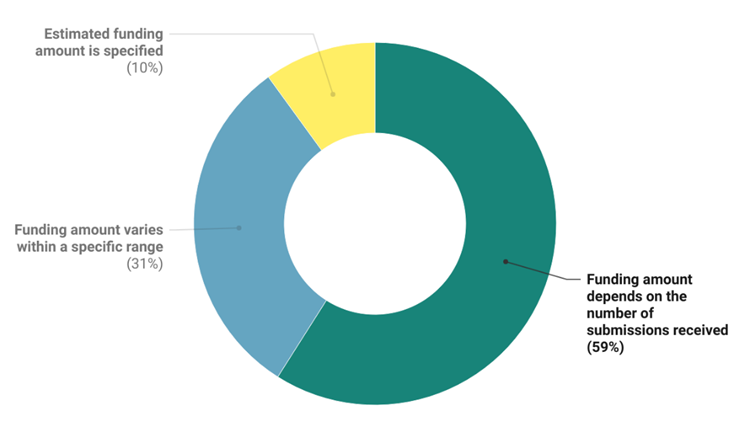
California State Library, California Grants Portal Data, July 2023. View more details.
04. How much funding was available per opportunity?
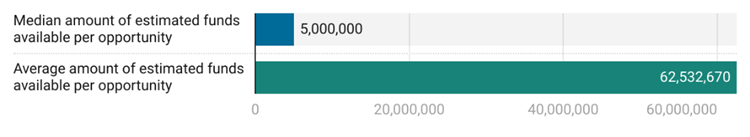
California State Library, California Grants Portal Data, July 2023. View more details.
05. How many visitors came to the California Grants Portal?
1,652,285
users visited the Grants Portal between July 2022 and July 2023—a 25 % increase in visits from the 2021-2022 fiscal year.
California State Library, California Grants Portal Data, July 2023. Google Analytics.
06. Which California Grants Portal pages were visited the most?
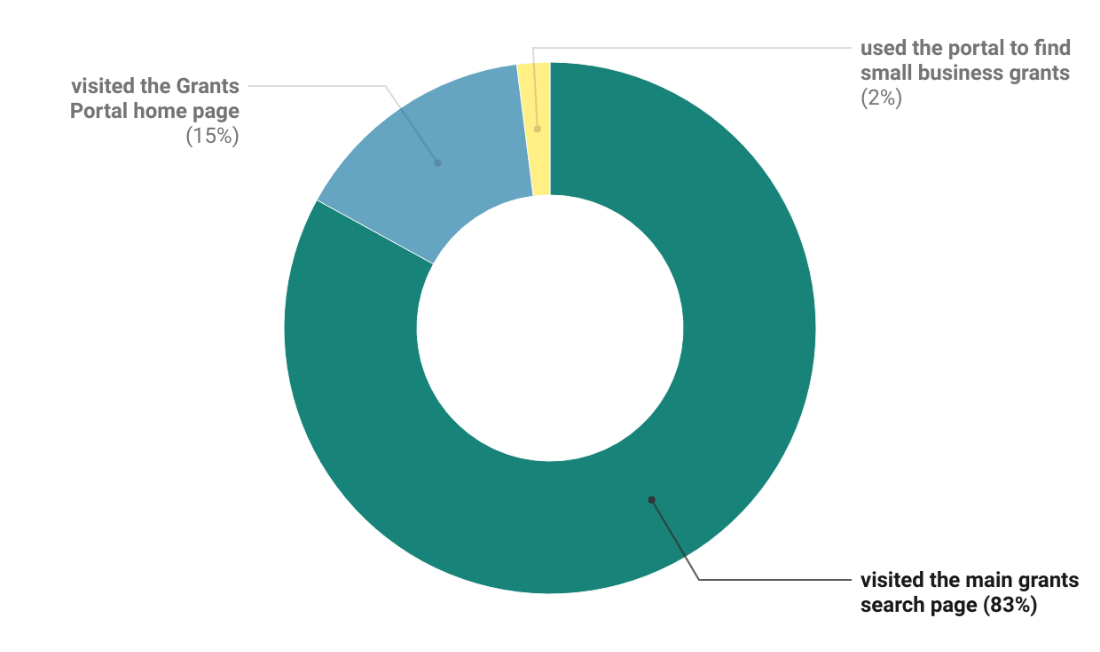
California State Library, California Grants Portal Data, July 2023. Google Analytics.
07. How many applications were submitted?
16,409
applications were submitted for opportunities available on the Grants Portal*
*Calculation includes applications submitted for ongoing and closed grants . Please advise, this number is accurate as of July 30, 2023.
California State Library, California Grants Portal Data, July 2023. View more details.
08. Public Awareness campaign since project implementation through July 2023.
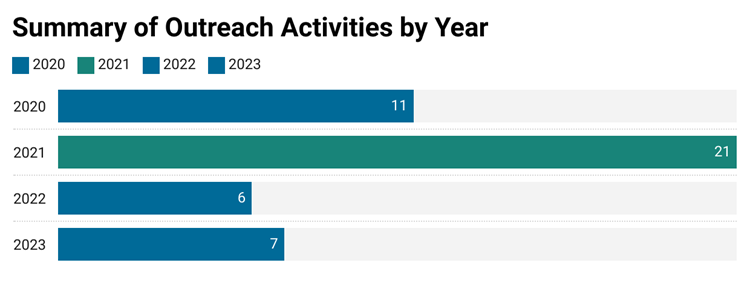
California State Library, California Grants Portal Data, July 2023. View more details.
09. AB 132 (section 8334.1) implementation and post award data for fiscal year 2022-2023.
AB132 (section 8334.1) expanded the Grants Portal mission, requiring state grantmakers to submit post award data for all grants closing on or after July 1, 2022. Grantmakers may begin submitting post award information as soon as a grant closes, and the data is finalized. Complete post award data should be submitted within six months of a grant closing (application deadline). Grantmakers that need additional time to collect awardee information must submit post award data within 12 months of a grant closing. Post award information for ongoing grants is due at the end of each fiscal year (no later than July 1). Grantmakers do not need to submit post award data for ongoing grants that have been open for less than one month.
Comprehensive, up-to-date post award grant information is available on the California Grants Portal Statistics Dashboard. Updated every 24 hours, this new dashboard offers an overview of the total grants funded, number of awarding departments, and funding by recipient type. Users can drill down by geographic region: county, out-of-state, or statewide. And whereas this report only provides summary data for grants offered for the 2022-2023 fiscal year, the dashboard offers a running total of estimated funding available, grants offered – including a breakdown into forecasted, active, or closed — participating departments, and the Top 10 funding departments from July 1, 2020, to present.
10. What’s next for the California Grants Portal?
Data transparency is central to our mission at the California State Library. We will continue to share all data from the Grants Portal in an easy-to-use format so stakeholders can learn more about the projects supported by state grants and loans, including the post award information.
Contact CAGrantsPortal@library.ca.gov for more information!