Annual Report – July 2021-2022
The California Grants Portal (grants.ca.gov), born out of the Grant Information Act of 2018 (Stats. 2018, Ch. 318), launched on July 1, 2020. To create this user-centered one-stop-shop funding destination, the California State Library collaborated with more than 50 state agencies, departments, commissions, and bureaus that award grants or loans on a competitive or first-come basis.
Comparing data from fiscal year 2020-2021 to 2021-2022, the Grants Portal saw growth in the number of visitors to the portal (18%), the number of grant and loan opportunities posted to the portal (37%), as well as the number of California state government entities posting their opportunities on the portal (13%).
Like fiscal year 2020-2021, state administered funding focused on COVID-19 relief disproportionately affected the number of applications submitted per opportunity. View or download current California Grants Portal data on the California Open Data Portal.
01. How many state agencies posted grants on the California Grants Portal?
59
Boards, Commissions, Conservancies, Councils, Agencies, Departments and Offices published funding opportunities on the Grants Portal – a 13% increase in participation from 2020-2021.
A bar chart depicting the top five entities with the highest percentage of opportunities. Governor’s Office of Emergency Services had 7.6% of the total opportunities, California Department of Food and Agriculture, 7.0%, Department of Resources Recycling and Recovery, 5.6%, Department of Health Care Access and Information, 5.2%, and California State Library, 5.0%.
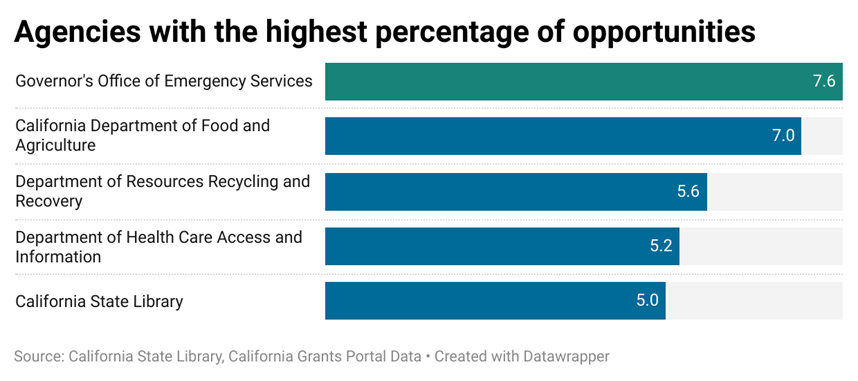
California State Library, California Grants Portal Data, July 2022. View more details.
02. How many opportunities were available on the California Grants Portal?
487
Funding opportunities were published on the Grants Portal – a 37% increase in opportunities from 2020-2021.
A column chart depicting of the top five grant opportunities by topic. 41% of opportunities fell under the Environment & Water category, 37% of opportunities fell under the Disadvantaged Communities category, 20% of opportunities fell under the Health & Human Services category, 19% of opportunities fell under the Education category, and 19% fell under the Housing, Community and Economic Development category.

* Calculation includes active, forecasted, and closed funding opportunities. Grants may be assigned multiple categories; therefore, percentages do not equal 100%.
California State Library, California Grants Portal Data, July 2022. View more details.
03. How do agencies determine available funding per opportunity?*
A donut chart depicting how agencies determine available funding per opportunity. For 8% of opportunities, an estimated funding amount was specified. For 32% of opportunities, the funding amount varied within a specific range. For 60% of opportunities, the funding amount was dependent on the number of submissions received, application process, etc.

* Calculation of average amount of funding per opportunity is not possible because most grantmakers (60%) determine final amounts based on the applicant pool. In the future, available post grant data will make this calculation possible.
California State Library, California Grants Portal Data, July 2022. View more details.
04. How much funding was available per opportunity?*
A bar chart displaying the average and median amount of estimated funds available per opportunity. The average amount of estimated funds available per opportunity was $68,504,201. The median amount of estimated funds available per opportunity was $5,000,000.
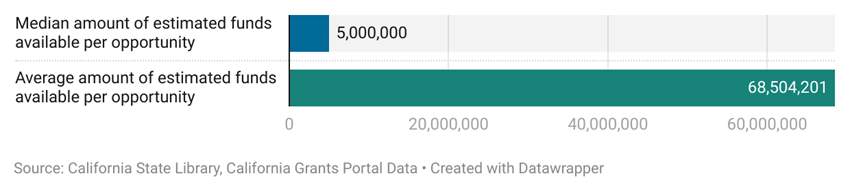
* See note near top about 2021-22 funding.
California State Library, California Grants Portal Data, July 2022. View more details.
05. How many visitors came to the California Grants Portal?
1,317,936
Users visited the Grants Portal between July 2021 and July 2022 – an 18% increase in visits from 2020-2021.
California State Library, California Grants Portal Data, July 2022, Google Analytics
06. Which California Grants Portal pages were visited the most?
A donut chart depicting which California Grants Portal pages were visited the most. 9% of visitors used the California Small Business COVID-19 Relief Grant page, 16% visited the Grants Portal homepage, and 75% visited the main grants search page.
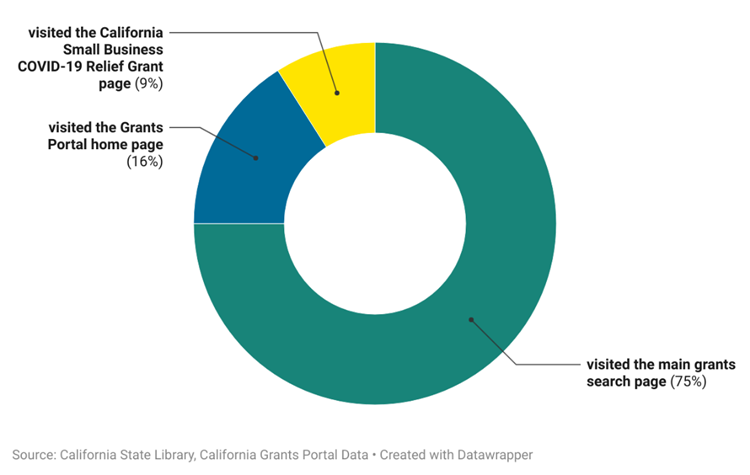
California State Library, California Grants Portal Data, July 2022, Google Analytics
07. How many applications were submitted?
109,501
Applications submitted for opportunities available on the Grants Portal*
*Calculation includes applications submitted for ongoing grants through July 2022
California State Library, California Grants Portal Data, July 2022. View more details.
08. What’s next for the California Grants Portal?
Starting July 2023, post-award data will be available, offering a first-ever look at how and where grants are distributed throughout California. This crucial new set of data is an opportunity to create greater public awareness of this tool as we continue to learn more about how ongoing agency data stewardship results in successful, positive granting processes throughout the State of California. Given that 49% of grant proposals are accepted via online submission and 32% by email, each year we learn more about how users are experiencing the portal, and in turn, we improve our user experience to increase equitable access to grant opportunities.
Data transparency is central to our mission at the State Library. We will continue to share all data from the Grants Portal in an easy-to-use format so all our stakeholders can learn more about the projects supported by state grants and loans.
Contact CAGrantsPortal@library.ca.gov for more information!